Analog and Digital Simulation
Nov 22, 1999
The simulations will be done using the commercial software, ``Electronics Workbench'', which is installed on the laboratory computers. With some preparation before the lab, you should be able to do both an analog and a digital simulation. The simulations run the circuits in software and all voltages, currents, and waveforms can be examined and printed out.
The circuits are entered by schematic capture, i.e. you draw the circuit on the computer screen by placing the parts and connecting them with wires. Once the circuit is entered, an analysis is run. There are several kinds of analyses including DC conditions, small signal transfer functions, and digital logic states for the case of digital circuits.
The analog simulation circuit will be the difference amplifier from the difference amplifier lab. Before the lab prepare a table of of the measured and calculated DC node voltages, the sum and difference gains, CMRR, and the amplifier high and low roll-off frequencies. You should have almost all this information in your laboratory notebook. The simulated circuit should have the same component values used in the lab circuit. The results of the simulation should then be entered as a separate column in your table.
Perform a DC analysis. Check the results agains the expected values.
The final results will include the table, a copy of the circuit diagram, waveforms, and your explanations as to why the simulation might be giving different results from theory and measurement.
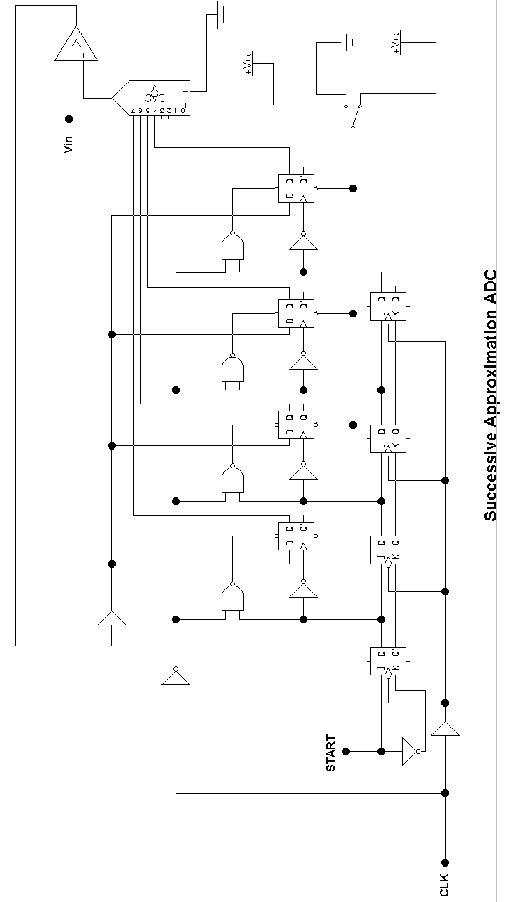
You will simulate a 4 bit Successive Approximation ADC made up of a DAC, comparator, D flip flops, J-K flip flops, and NAND gates. You will enter a DC input voltage, run the simulation, and read out the digital state of the circuit under the control of CLK pulses. The circuit also includes START and RESET lines.
